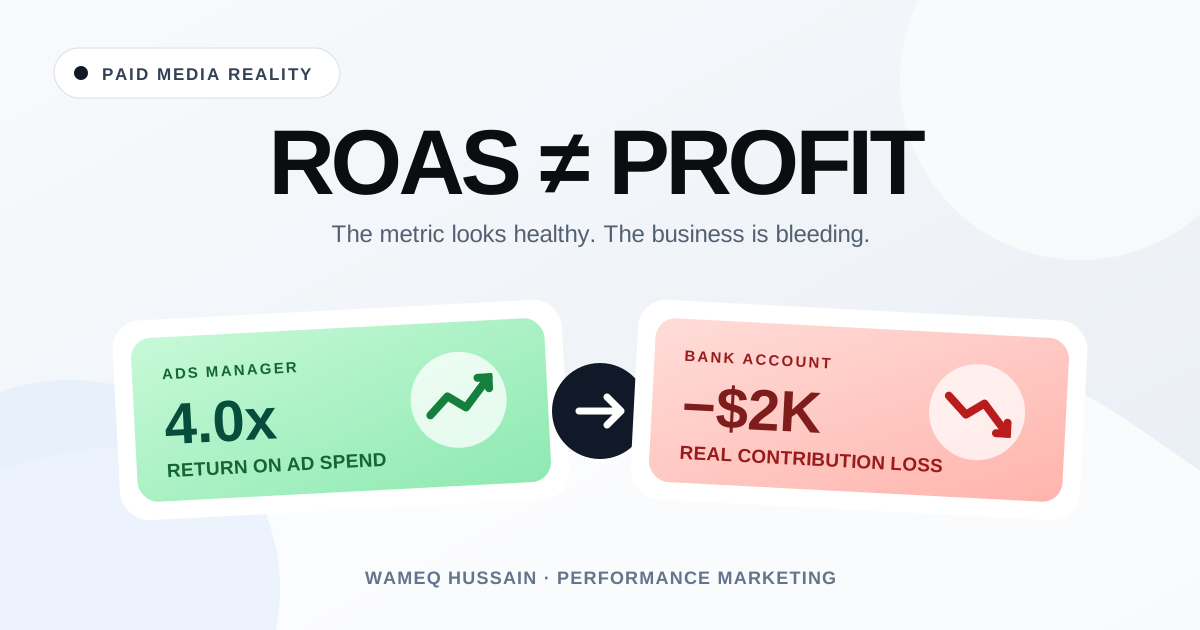
Your ads report healthy ROAS while margin keeps shrinking. See where the numbers split—and how to measure whether paid media actually makes money.
Your Google Ads account says 4.8x ROAS. Meta says 3.6x. Revenue is growing. Everyone in the weekly meeting looks happy.
There is just one problem: the business is still losing money.
This is not unusual. Advertising platforms are very good at reporting revenue they influenced. They are not designed to tell you whether the company made a profit.
The short answer is simple: your ads can look profitable while the business loses money because ROAS measures attributed revenue against ad spend, not the margin left after every cost—and not whether the advertising caused the sale in the first place.
ROAS is not a profit metric
Return on ad spend is one division:
Attributed revenue ÷ advertising spend = ROAS
If a platform attributes $100,000 of revenue to $25,000 of spend, it reports 4.0x ROAS. That calculation is correct. It is also incomplete.
The formula does not know what the product cost. It does not know whether the order was discounted, returned, cancelled, or expensive to ship. It does not know what the payment provider charged. It does not know whether customer support spent an hour fixing the order. And unless you send clean first-party data back, it often does not know whether the buyer was new or had already purchased six times.
ROAS answers: how much revenue did this platform claim per dollar of spend?
The business needs a different answer: how much money did we keep because we spent that dollar?
A 4.0x ROAS business that loses money
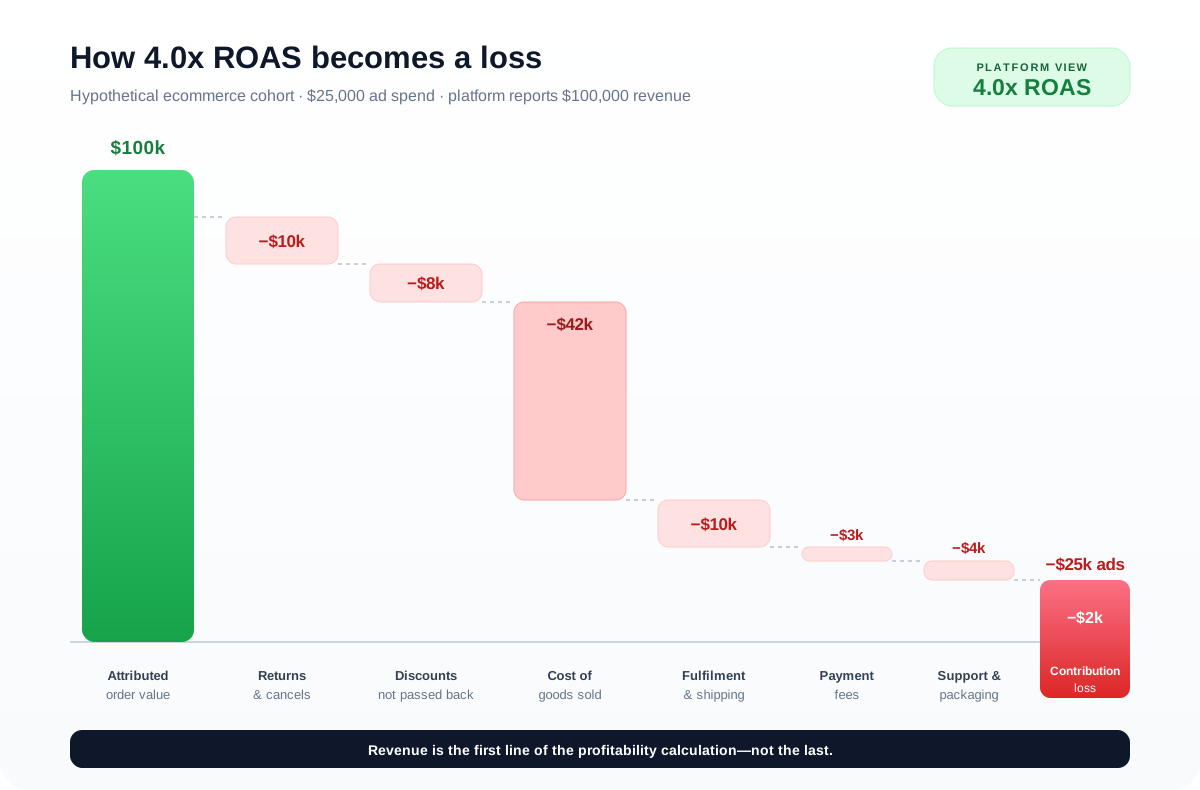
Here is a deliberately simple ecommerce example. These are hypothetical numbers, but the structure is the same one I use when an account looks healthy and the bank balance says otherwise.
| Line item | Amount | What the ad platform sees |
|---|---|---|
| Platform-attributed order value | $100,000 | Yes |
| Returns and cancellations | −$10,000 | Often late or incomplete |
| Discounts not reflected in tracking value | −$8,000 | Sometimes |
| Net sales | $82,000 | Rarely used for bidding |
| Cost of goods sold | −$42,000 | No |
| Fulfilment and shipping subsidy | −$10,000 | No |
| Payment and marketplace fees | −$3,000 | No |
| Variable support and packaging | −$4,000 | No |
| Advertising spend | −$25,000 | Yes |
| Contribution profit | −$2,000 | No |
The dashboard celebrates 4.0x ROAS. Net revenue ROAS is already lower at 3.28x. After the variable costs required to create and fulfil those orders, the campaign produces a $2,000 contribution loss.
Want this implemented for your funnel?
Get a free 90-day growth plan with tracking, channel priorities, and next-week actions.
Where the money usually disappears
1. The platform optimises gross revenue while you keep gross margin
Two products can each generate $100 of revenue and have completely different economics. Product A might leave $70 before advertising. Product B might leave $18. If both send a purchase value of $100 into the ad platform, the bidding system sees them as equally valuable.
They are not equally valuable to the business.
This becomes worse when the low-margin product converts more easily. The algorithm finds the cheapest path to the conversion value you supplied, so it can shift spend toward the item that makes its ROAS look best while making your blended margin worse. The platform is not malfunctioning. It is following the instruction.
The fix is to send margin-adjusted values or separate conversion values by product, plan, customer type, or lead quality. If you only feed revenue into the model, you are asking it to maximise revenue.
2. Discounts improve conversion and quietly destroy contribution
A 20% discount can lift conversion rate, reduce reported CPA, and increase ROAS. It can also remove most of the profit from an order.
This is why promotion weeks often create the best-looking advertising screenshots of the quarter. More people convert, the platform learns faster, and attributed revenue rises. The dashboard does not place a red warning next to every order that used a code.
Report full-price and discounted orders separately. At minimum, track discount rate, average discount depth, contribution margin by offer, and the percentage of buyers who were new. Otherwise the campaign can be paying to give a cheaper price to customers who were already ready to buy.
3. Returns arrive after the campaign has taken credit
Many dashboards record the purchase immediately and never receive a clean refund adjustment. Fashion, beauty, consumer electronics, subscriptions, and marketplaces can all have material cancellation or return lag.
A campaign may look excellent in week one, receive more budget in week two, and reveal its real economics in week six when returns settle. If the business reviews recent ROAS without matching the cohort to settled returns, it is scaling an unfinished number.
Use a fixed maturity window. Compare 30-day or 60-day settled revenue by acquisition cohort, depending on the normal return period. Do not compare a fully matured January cohort with an incomplete March cohort and call the difference performance.
4. Shipping, fulfilment, payment fees, and support are treated as somebody else's problem
These costs rarely live inside Ads Manager, so marketing teams often exclude them from campaign decisions. The business cannot exclude them from cash flow.
Free shipping is not free. Buy-now-pay-later has a fee. Marketplace commissions change by category. Heavy products cost more to fulfil. A low-quality campaign can also generate more support tickets, failed deliveries, chargebacks, and exchanges.
You do not need perfect order-level accounting before making a better decision. Start with realistic variable-cost averages by product category and channel. Improve the model as the data becomes available.
5. Returning customers are reported as acquisition wins
Suppose an existing customer sees a retargeting ad and buys the product they purchase every month. The platform can claim the order. The campaign can show a very low CPA. Revenue was captured, but customer acquisition did not happen.
This is one of the fastest ways to make paid media look more efficient while the company stops growing.
Split new and returning customers in both conversion data and reporting. Track:
- new-customer revenue and ROAS;
- new-customer CAC;
- returning-customer spend and revenue;
- blended CAC across the whole business;
- repeat rate without paid retargeting.
Retargeting can still be commercially useful. It should be described as retention or demand capture—not presented as net-new growth.
6. Several platforms claim the same order
A buyer watches a Meta video on Monday, clicks a Google ad on Thursday, opens an email on Friday, and purchases. Meta can claim it. Google can claim it. The email platform can claim it. An affiliate tool may also claim it if a cookie exists.
The accounting system still records one order.
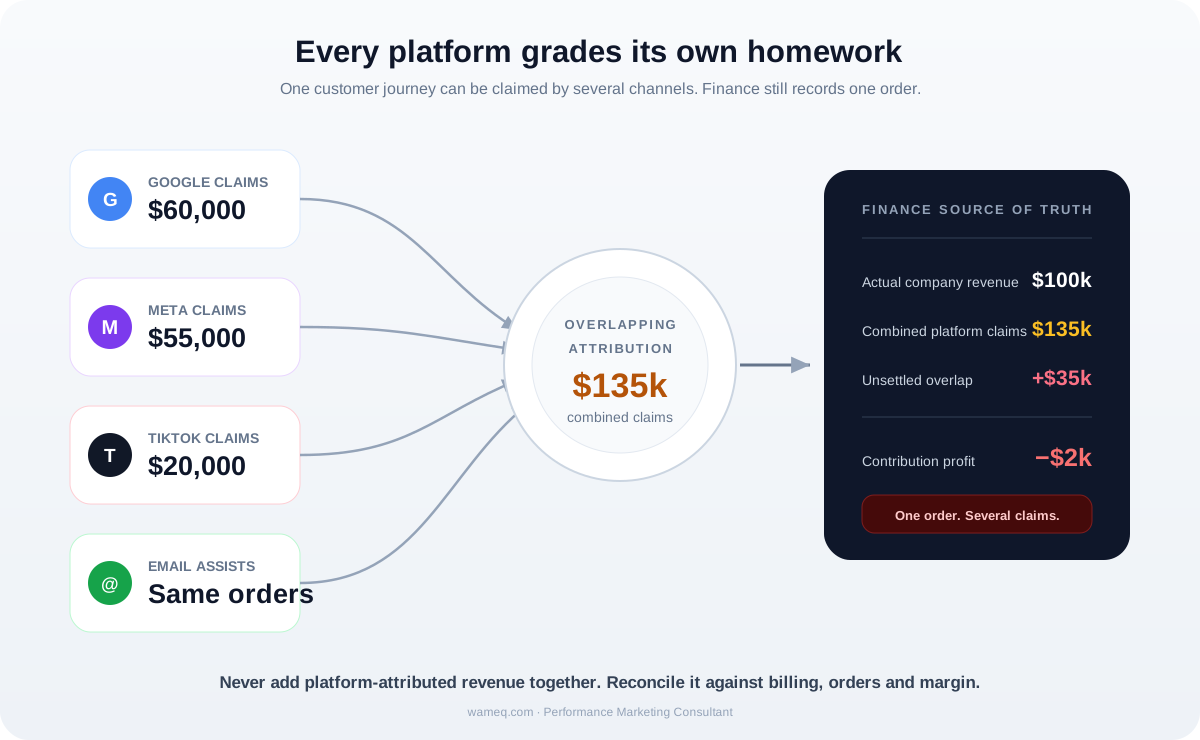
If Google reports $60,000, Meta reports $55,000, and TikTok reports $20,000 against $100,000 of actual company revenue, the combined dashboard claim is $135,000. Nothing fraudulent needs to happen for this result. The platforms are applying different attribution rules to overlapping journeys.
Never add platform-reported revenue together. Reconcile against the order or billing system, then use an attribution model to understand assistance. My guide to marketing attribution explains the available models and their limitations.
7. The ad receives credit for demand it did not create
Brand search is the obvious example. Someone already knows the company, searches its name, clicks the ad above the organic result, and buys. The campaign reports a conversion and often an exceptional ROAS.
The click was real. The attribution was real. The incrementality may be close to zero.
The same issue appears in remarketing, shopping ads for famous products, and campaigns launched during a seasonal demand spike. Attribution shows who touched the journey. Incrementality asks what changed because the ad existed.
That is why mature accounts need holdout tests, brand-suppression tests, or conversion-lift experiments. The wider measurement framework is covered in how to measure PPC performance when AI controls the auction.
The number you need: contribution profit
For day-to-day marketing decisions, full company net profit is often too broad. It includes fixed costs that do not change when one more order arrives: office rent, permanent salaries, insurance, and other overhead.
Contribution profit is the more useful bridge between an advertising dashboard and the profit-and-loss statement:
Net revenue − variable product and service costs − acquisition spend = contribution profit
For ecommerce, include:
- revenue after discounts, refunds, cancellations, and tax treatment;
- cost of goods sold;
- pick, pack, fulfilment, and shipping subsidy;
- payment, marketplace, and financing fees;
- variable packaging, support, chargebacks, and warranty cost;
- advertising and channel-specific commissions.
For SaaS, the list changes: hosting and usage cost, onboarding labour, sales commission, payment fees, and support load matter more. For lead generation, replace order margin with qualified-lead rate, sales acceptance, close rate, contract value, and delivery cost.
The principle does not change. Give the acquisition team the economics of the outcome it is buying.
Calculate your break-even ROAS
Once you know contribution margin before advertising, the break-even calculation is straightforward:
Break-even ROAS = 1 ÷ contribution margin before ad spend
| Margin before advertising | Break-even ROAS | Meaning |
|---|---|---|
| 70% | 1.43x | $70 remains from every $100 before ads |
| 50% | 2.00x | $50 remains from every $100 before ads |
| 40% | 2.50x | $40 remains from every $100 before ads |
| 30% | 3.33x | $30 remains from every $100 before ads |
| 20% | 5.00x | $20 remains from every $100 before ads |
Break-even is not a target. It is the point at which the next order contributes zero before fixed overhead. A business needs a margin of safety above it to fund salaries, product development, stock risk, and profit.
Also calculate this by product or service line. A blended 45% margin can hide one category at 75% and another at 12%. One account-level target ROAS will push the algorithm toward whichever category converts most easily, not necessarily the one that creates the most profit.
The profitability dashboard I would put in the weekly meeting
Keep platform metrics for optimisation, but do not let them lead the commercial conversation. I would organise the report into four rows.
1. Actual business outcome
- net revenue from the billing or order system;
- contribution profit and contribution margin;
- cash collected, where payment timing matters;
- new customers and net-new recurring revenue.
2. Acquisition efficiency
- blended CAC: all acquisition spend divided by total new customers;
- new-customer CAC by major channel;
- CAC payback period;
- incremental ROAS when a valid test exists.
3. Margin leakage
- discount rate and average discount depth;
- returns, cancellations, chargebacks, and failed deliveries;
- product mix and gross margin by cohort;
- shipping and fulfilment per order.
4. Platform diagnostics
- spend, attributed revenue, ROAS, and CPA;
- conversion rate and average order value;
- creative, query, audience, and placement findings;
- the hypothesis currently being tested.
The order matters. Leadership sees whether the business made money before it sees which platform wants credit.
Five checks to run before increasing the budget
- Reconcile revenue. Compare platform-attributed revenue with the order, billing, or CRM system for the same cohort and time zone. Explain the gap before scaling it.
- Use settled economics. Include normal return and cancellation lag. If the cohort is incomplete, label it incomplete.
- Separate new from returning. Confirm that customer acquisition is growing—not only paid retention.
- Check contribution margin by product and offer. Make sure the campaign is not concentrating spend on discount-heavy or low-margin revenue.
- Watch blended CAC. If the platform CPA improves while blended CAC rises, the platform may be taking more credit for the same total demand.
If those five checks are healthy, higher spend has a commercial case. If only platform ROAS is healthy, you have a screenshot—not a case.
What to do when the ads are efficient but the business is not
Do not begin by changing bids. Begin by finding which layer is broken.
- If gross margin is weak: change product mix, pricing, bundles, or the conversion values sent to the platforms.
- If discounting is the leak: test value-led offers, thresholds, gifts, bundles, or segmented promotions instead of site-wide percentage cuts.
- If returns are the leak: fix product expectations, sizing, quality, landing-page clarity, and the campaigns attracting the wrong buyer.
- If existing customers dominate: split retention from acquisition and set a real new-customer target.
- If attribution is inflated: shorten inappropriate windows, deduplicate events, reconcile against finance, and run an incrementality test.
- If fulfilment is the leak: change shipping thresholds, markets, packaging, carriers, or the products being promoted.
Paid media can expose a broken business model faster because it adds volume. It cannot repair the model by itself.
The bottom line
ROAS is useful. It is not truth.
It is a platform-specific efficiency signal built from attributed revenue. Use it to compare campaigns under similar conditions, diagnose changes, and guide tactical optimisation. Do not use it as a substitute for profit.
The decision to scale should come from contribution margin, blended CAC, cash payback, new-customer growth, and evidence that the advertising caused additional demand. When those numbers improve together, the dashboard and the business are finally telling the same story.
If the ad accounts look profitable and the business does not, I would start with the measurement chain before touching the campaigns. My analytics and CRO work connects platform activity to real revenue and margin; my paid media work then uses that signal to control spend.
Get weekly growth ideas in your inbox
Practical SEO, PPC, analytics, and CRO notes with zero spam.
Frequently Asked Questions
Can ads have a high ROAS and still lose money?▾
What is the difference between ROAS and profit?▾
What is a good ROAS?▾
How do I calculate break-even ROAS?▾
Why does platform revenue exceed actual store revenue?▾
Which metrics should replace platform ROAS?▾

Digital marketing consultant — SEO, PPC, analytics & CRO.