
A/B test sample size calculation is the step most CRO teams skip — and it is why so many split tests get called as winners on day four and quietly underperform once shipped. This guide walks through baseline conversion rate, minimum detectable effect, alpha, statistical power and the two-proportion formula, then runs the math against a real funnel scenario so you can plan tests that reach statistical significance instead of guessing.
Most A/B Tests Never Reach Statistical Significance
The pattern is the same across most teams. A new variant goes live on Monday. By Thursday it is up 12% on conversion rate. Someone screenshots the dashboard, declares a winner, ships the change to 100% of traffic and moves on. Three weeks later the overall conversion rate is exactly where it started or slightly lower, and nobody can explain why.
The reason is that the split test never had the statistical power to detect anything real in the first place. The 12% lift on Thursday was noise, not statistical significance. Run the same coin flip a thousand times and you will hit a four-day stretch where heads beats tails by a wide margin. That stretch does not mean the coin is biased.
This is what conversion rate optimisation actually requires before you touch a page: an A/B test sample size calculation. Four numbers go in — baseline conversion rate, minimum detectable effect, alpha (the statistical significance threshold) and power — and one number comes out: how many visitors per variant the test needs before the result means anything. Most teams skip this entirely. The ones that run it through a sample size calculator find out their planned test would need three months of traffic to detect the lift they were hoping for, and they go back and pick a more aggressive change.
This guide walks through each of the four inputs, then shows the formula and a worked scenario using a real funnel. By the end you will be able to plan a split test, calculate the sample size, convert it into a duration and decide whether the test is worth running at all.
The Scenario We Will Use Throughout
Here is the funnel we are going to test against. Last 30 days, a B2C SaaS subscription product running paid acquisition to one landing page:
| Step | Volume (30d) | Rate |
|---|---|---|
| Landing page sessions | 180,000 | — |
| Reached pricing | 54,000 | 30.0% of LP |
| Reached signup form | 7,560 | 14.0% of pricing |
| Completed signup | 3,250 | 43.0% of signup · 1.8% of LP |
| Activated within 7 days | 780 | 24.0% of signups |
Segment splits matter and we will come back to them: mobile is 58% of sessions at 1.3% LP-to-signup, desktop is 42% at 2.5%. Paid is 65% at 1.5%, organic is 35% at 2.4%. ARR per paying user is around $79/month and recurring revenue added in the last 30 days is roughly $257K.
Eyeballing the funnel, the biggest leak is pricing-to-signup at 14.0%. Out of 54,000 people who reached pricing, only 7,560 clicked through to start signup. That is the step worth testing first because the absolute volume of people lost there is the largest of any single step in the funnel. Our hypothesis: a simplified pricing page lifts pricing-to-signup from 14.0% to 15.4%, a 10% relative lift.
Want this implemented for your funnel?
Get a free 90-day growth plan with tracking, channel priorities, and next-week actions.
Step 1: Calculate the Right Baseline
Baseline is the current conversion rate of the step you are testing. The most common mistake here is using the end-to-end funnel rate as the baseline for a single-step test. If you do that for the pricing page test above, you would use 1.8% (LP to completed signup) instead of 14.0% (pricing to signup). The required sample size jumps from a few thousand per variant to several tens of thousands, because tiny baselines need huge samples to detect lifts.
The rule is: baseline is the conversion rate of the specific transition that the change can influence. A pricing page change cannot make people land on the site, so LP traffic does not belong in the denominator. A pricing page change can move people from pricing to signup, so pricing sessions are the denominator and signup-form entries are the numerator.
The baseline should be measured over a stable recent window, typically 28 to 90 days, with any anomalies excluded. A promotional week or a tracking outage will skew the baseline and make every downstream calculation wrong. For our scenario, baseline is p₁ = 14.0%, measured over the last 30 days, with no campaigns or outages distorting the period.
Step 2: Choose Your Minimum Detectable Effect (MDE)
MDE is the smallest lift you want the test to be able to detect. It is a planning input, not a measurement. You are saying in advance: if the variant produces at least this much improvement over the baseline, I want to be confident the test will catch it. If the variant produces a smaller improvement than that, I am willing to miss it.
MDE is usually expressed as a relative lift over the baseline, not an absolute one. A 10% relative MDE on a 14.0% baseline means you want to detect a new rate of 15.4% (14.0 × 1.10). A 5% relative MDE on the same baseline means you want to detect 14.7% (14.0 × 1.05).
The mathematical relationship between MDE and sample size is brutal. Halving the MDE roughly quadruples the sample size required. This is the reason "let us see if anything moves" tests almost never finish — they implicitly demand a tiny MDE and the sample size for that runs into months of traffic. In CRO the practical floor for MDE is usually 5% relative for high-traffic sites and 10 to 15% relative for everything else. Below 5% you are testing for changes that are smaller than the natural week-to-week variance of the metric and the test cannot tell signal from noise.
For our scenario, MDE = 10% relative. We want to detect p₂ = 15.4% or better.
Step 3: Set Alpha — Your Statistical Significance Threshold
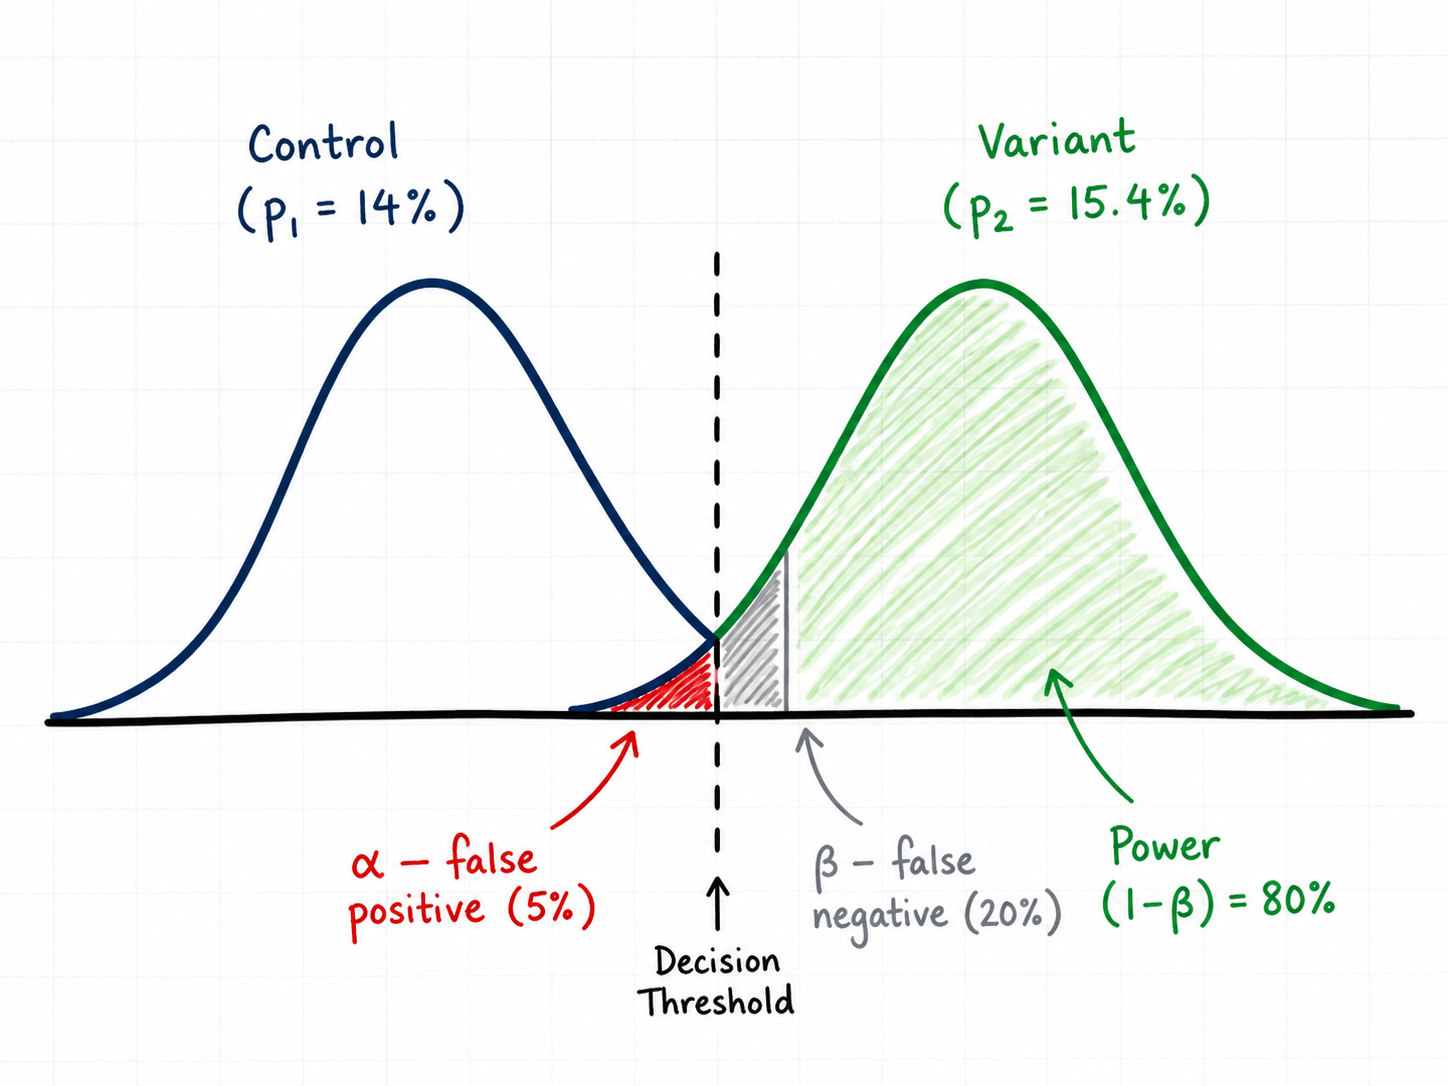
Alpha (α) is the probability you are willing to accept of declaring a winner when there is actually no difference. This is a false positive — also called Type I error. Alpha is what people are referring to when they say a test "reached statistical significance" — a result is significant when its p-value is below α. The conventional value is α = 0.05, meaning you accept a 5% chance of being wrong in that direction. Lower alpha (0.01) means stricter evidence required and larger sample size. Higher alpha (0.10) is looser and rarely used outside very early-stage exploration.
Two-tailed vs one-tailed is a separate decision and one that most CRO posts get wrong by reflex. A two-tailed test asks "is the variant different from the control in either direction?" A one-tailed test asks "is the variant better than the control?" and treats "worse" as the same outcome as "no difference".
One-tailed tests cut the required sample size by roughly 20% which is why they are tempting. The problem is that they assume you genuinely do not care if the variant turns out worse — that you would ship it either way, or that the consequences of shipping a losing variant are zero. In real CRO neither of those is true. If your simplified pricing page actually drops signup entries by 8%, that is roughly $20,500 of MRR) — see glossary" class="glossary-link">monthly recurring revenue you need to know about, not absorb silently. Use two-tailed unless you have a very specific reason not to.
For our scenario, α = 0.05 two-tailed. The corresponding critical value is Zα/2 = 1.96.
Step 4: Set Power — and Why 80% Is the Floor
Power is the probability of detecting a real effect of the size you specified, if it actually exists. Power = 1 − β, where β is the probability of a false negative (Type II error — missing a real winner).
The convention is power = 0.80, meaning if the true lift is exactly your MDE, the test will return a significant result 80% of the time. Power = 0.90 is stricter — roughly 30% more sample size — and is worth using when the cost of missing a real winner is high. Power below 70% means you are running tests that mostly cannot succeed even when the variant is genuinely better, which is the silent reason most CRO programs stall: a backlog of "inconclusive" results that were actually winners the test was never going to detect.
For our scenario, power = 0.80. The corresponding critical value is Zβ = 0.8416.
The Sample Size Formula for Two Proportions
For an A/B test comparing two conversion rates, the standard sample size per variant is:
n = ( Zα/2 · √(2·p̄·q̄) + Zβ · √(p₁·q₁ + p₂·q₂) )² / (p₁ − p₂)²
Where:
- p₁ = baseline conversion rate, q₁ = 1 − p₁
- p₂ = baseline × (1 + MDE), q₂ = 1 − p₂
- p̄ = (p₁ + p₂) / 2 (pooled rate), q̄ = 1 − p̄
- Zα/2 = 1.96 for α = 0.05 two-tailed
- Zβ = 0.8416 for power = 0.80
The formula gives sample size per variant. Total exposures needed is 2n for an A/B test, 3n for an A/B/C, and so on. The (p₁ − p₂)² in the denominator is the part that punishes small MDEs — halve the difference and the denominator shrinks fourfold, which means n grows fourfold.
Worked Calculation: The Pricing Page Test
Plugging the scenario into the formula:
- p₁ = 0.140, q₁ = 0.860
- p₂ = 0.140 × 1.10 = 0.154, q₂ = 0.846
- p̄ = (0.140 + 0.154) / 2 = 0.147, q̄ = 0.853
- p₁ − p₂ = −0.014, (p₁ − p₂)² = 0.000196
- p₁·q₁ = 0.1204, p₂·q₂ = 0.1303, sum = 0.2507
- 2·p̄·q̄ = 0.2508
Computing:
n = ( 1.96 · √0.2508  +  0.8416 · √0.2507 )²  /  0.000196
n = ( 1.96 · 0.5008  +  0.8416 · 0.5007 )²  /  0.000196
n = ( 0.9815  +  0.4214 )²  /  0.000196
n = ( 1.4029 )²  /  0.000196
n = 1.968  /  0.000196
n ≈ 10,042 per variant
So we need about 10,042 visitors who reach the pricing page on each variant — roughly 20,084 total pricing-page exposures across the two variants.
Convert Sample Size Into Test Duration
Sample size in isolation is just a number. What matters operationally is how long the test will take to reach it given the current traffic to the test surface.
The test surface here is the pricing page. From the funnel, that is 54,000 visitors per month, which is roughly 1,800 per day. Splitting traffic 50/50 between control and variant gives 900 per variant per day. Reaching 10,042 per variant takes 10,042 / 900 ≈ 11.2 days mathematically.
Mathematically. In practice you should always run for full weeks, with a 14-day floor, regardless of what the math says. Day-of-week effects are real and a test that ran Monday to Friday is not measuring the same population as a test that ran across two full weeks. Visitor behaviour, traffic mix and even page speed differ by day of week. Testing across one full Monday-to-Sunday cycle is the minimum that absorbs that variance; two full cycles is better.
So: math says 11.2 days, run it for 14. The extra days do not cost you anything and they protect you from shipping a result that was an artefact of two strong Wednesdays in a row.
What Happens When You Reduce the MDE
To make the squared-relationship concrete, here is the same scenario at different MDEs:
| Relative MDE | Target rate (p₂) | Sample / variant | Test duration (50/50, 1,800/day) |
|---|---|---|---|
| 15% | 16.1% | ~4,550 | ~6 days math · run 14 |
| 10% | 15.4% | ~10,040 | ~12 days math · run 14 |
| 5% | 14.7% | ~39,380 | ~44 days · run 49 |
| 2% | 14.3% | ~246,300 | ~274 days — do not run this |
Two takeaways. First, halving the MDE roughly quadruples the sample size — the math is unforgiving. Second, very small MDEs are not testable on most pages. If you cannot articulate a hypothesis that you believe will lift the metric by at least 5 to 10% relative, the test is not worth designing because you do not have enough traffic to find the answer.
The Segment Trap: Mobile vs Desktop, Paid vs Organic
Looking at the scenario again: mobile is 58% of sessions at 1.3% LP-to-signup, desktop is 42% at 2.5%. That is roughly a 2x difference in conversion rate between devices. The instinct is to test only on desktop where the rate is higher, or only on mobile where the volume is.
The math problem with segmenting is that you are now testing on a smaller population. Desktop is 42% of pricing-page traffic, so roughly 756 desktop visitors per day. The 10,042-per-variant requirement now takes 27 days of mathematical sample, which means a 28-day test in practice (four full weeks) to absorb day-of-week effects. That can still be the right call — testing only on desktop avoids contaminating the result with a mobile experience that may not benefit from the same change — but you have to plan for the longer duration.
The bigger trap is making the segmenting decision after seeing the result. If you run a sitewide test, see that desktop won and mobile lost, and then declare the desktop result a winner, you have just inflated your false positive rate by an unknown amount. Pre-register which segment you are testing, run the test, and treat any post-hoc segment splits as hypothesis generation for the next test, not as decisions you ship from.
Where Most CRO Tests Go Wrong
The four mistakes that account for most false-positive shipped variants:
Peeking and stopping early. Looking at the dashboard daily and stopping the test when significance appears inflates your alpha from 5% to 20% or higher, depending on how often you peek. Either commit to the predetermined sample size and only check at the end, or use a sequential testing method (Bayesian, group sequential) designed to handle interim looks. Most CRO tools support both — pick one and follow its rules.
Novelty effects. A new variant often gets a temporary lift just because it is new to returning visitors. This decays over a few weeks. Tests shorter than two full weeks will overstate the lift of any visually distinctive change. If your variant is a major redesign rather than a small change, run for at least three weeks.
Multiple variants without correction. Running A/B/C/D on the same page with α = 0.05 each gives you a combined false positive rate well above 5%. With four variants, the chance that at least one shows a fake lift jumps to roughly 18%. Either reduce alpha per variant (Bonferroni: α / number of variants) or commit to head-to-head tests.
Ignoring the post-test funnel. A pricing page change might lift pricing-to-signup by 12% but drop signup-to-activation by 15% because the variant attracts more curious browsers who never actually use the product. Always measure the downstream step too. The metric you are optimising should be activated users per pricing-page visitor, not pricing-to-signup in isolation.
A/B Test Sample Size Calculators We Recommend
You do not need to run the formula by hand once you understand what it is doing. The A/B test sample size calculator on this site takes the same inputs walked through above and adds a test-duration estimator that uses your actual daily traffic — so you get sample size per variant and the number of days the split test will need to run, in one place.
If you want a second opinion or prefer a different interface, these statistical significance calculators all use the same underlying math:
The CRO Test Planning Checklist
Before any A/B test goes live, you should be able to answer all of the following in writing:
- What step in the funnel does this change affect? That step is your baseline denominator.
- What is the baseline rate over the last 28–90 days? Excluding any anomalies.
- What MDE are you committing to detect? Stated as a relative lift over baseline.
- What alpha and power? Default to 0.05 two-tailed and 0.80.
- What sample size per variant does that produce? From the formula or a calculator.
- How many days at current traffic? Then round up to the nearest full week, with a 14-day floor.
- Are you testing the whole population or a segment? Decide before, not after.
- What is the downstream metric? The step you are optimising should not cannibalise the next step.
If you cannot answer these eight questions before the test launches, the test is not designed yet. The cost of writing them down is fifteen minutes. The cost of not writing them down is six months of inconclusive results and shipped false positives that quietly drag the metric you were trying to improve. The teams that compound CRO wins are the ones that treat the planning step as the actual work and the test itself as the easy part. User behaviour data tells you what to test; the math in this post tells you whether the test you designed can actually answer the question.
Get weekly growth ideas in your inbox
Practical SEO, PPC, analytics, and CRO notes with zero spam.
Frequently Asked Questions
What is baseline conversion rate in an A/B test?▾
What is Minimum Detectable Effect (MDE) in CRO testing?▾
What does alpha 0.05 two-tailed actually mean?▾
What is statistical power and why does 80% matter?▾
How long should an A/B test run?▾
Can I stop an A/B test early if a variant is clearly winning?▾
Digital marketing consultant — SEO, PPC, analytics & CRO.


